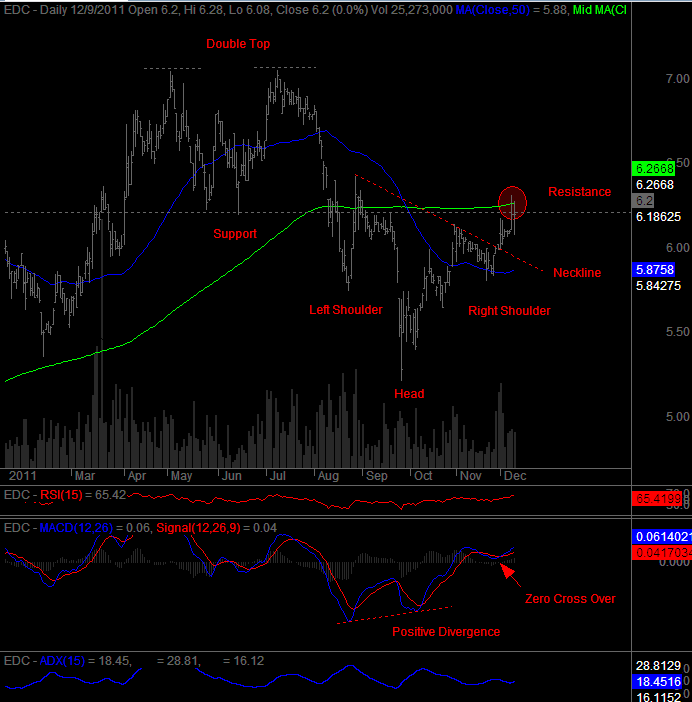
Moving Average Convergence Divergence (MACD) shows that there is a rising upward momentum but the uptrend is still not that strong based on the Average Directional Index (ADX) value just below 20. If ADX line moves up above 20 or 25 and rising, then the trend is getting stronger.
Last Friday (Dec 9), price action formed a Long Legged Doji. Long Legged Doji shows that there is a great amount of indecision in the market and is also a reversal type of candlestick. This definitely needs a confirmation on the next trading day in order to judge that a reversal may be starting. Having said this, it can do a return move on the neckline of the head and shoulders bottom pattern.
PD: I have EDC and my stop loss here is below 6 or at 5.90 level or if it breaks down from the neckline and or 50dMA.
Disclaimer: This is my personal technical analysis on this stock. It is not my intention to give a buy or sell advise. Trade at your own risk
Nice, Prof Chu. Wavewise, it also appears EDC came from a 5th-wave failure (July to Sept). This means the entire wave will be retraced. also got a BUY to ENTER A POSITION Signal last 11/29. Good luck! JK here, good morning!
ReplyDeleteGood evening JK! Thanks and I really appreciate your input here.
ReplyDeleteFeel free to comment ha... I need second opinions. Thanks.
ReplyDelete