
Wednesday, November 14, 2012
Saturday, October 13, 2012
EDC
Good if EDC will breakout from the said resistances... Think twice if breakdown from the possible neckline of the 3rd H&S.
Just sharing my observation...
Pd: No EDC

Sunday, September 23, 2012

Sunday, September 16, 2012

Saturday, September 15, 2012


Friday, September 14, 2012

Tuesday, September 11, 2012


Wednesday, September 5, 2012

ZHI
Spotted a weakening trend for ZHI.
Bullish Gartley + Divergence. Seems like a good signal. Will monitor this.

Bullish Gartley + Divergence. Seems like a good signal. Will monitor this.
Question is will it close 2 more gaps below?
Tuesday, September 4, 2012

Sunday, September 2, 2012

Friday, August 31, 2012


Thursday, August 30, 2012

Thursday, August 23, 2012
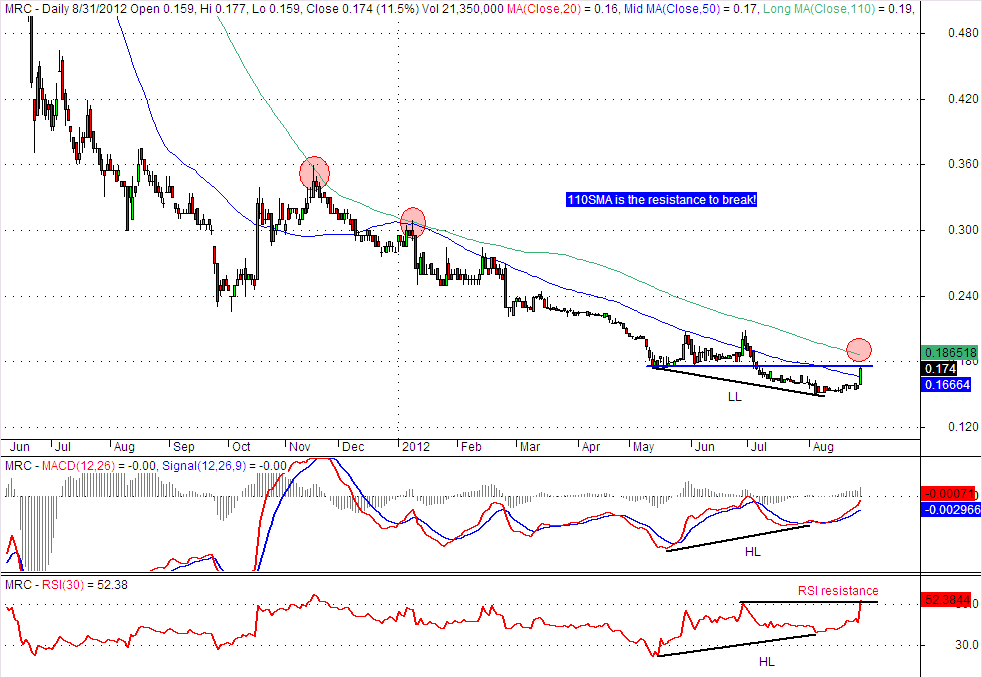
PSEi
RSI Divergence taking effect... We see price making higher highs but RSI is making lower highs from May to July 2012.
Divergence doesn't mean that there will be a reversal of the trend... It simply signals us that there might be a change on the prior trend... can be sideways... sideways to up or sideways to down or totally reversal of trend.

Now PSEi, is retesting my 110SMA and horizontal support line. A bounce at this level we might be seeing a triangle formation (Descending?) Hope maging Symmetrical.
So plan your trades well as we are about to test a critical support.
Monday, August 20, 2012
CPG
Daily
- 3rd attempt to break the descending resistance line
- So far momentum upward seems to be positive as RSI broke the 1st and 2nd resistance line
- For a better signal of upward momentum, MACD must move above zero line
- Hanging Man candlestick at resistance. This is a bearish candlestick but with low reliability
Weekly
- MACD cross might be a good signal. Let's see
Bought some at 1.45
Cut Loss below 50SMA or 1.43/1.44
Sunday, August 19, 2012
GEO
GEO Weekly Chart showing a possible Bullish Bat Pattern
Got in last week at 0.57
Resistance to break is 0.61 and 0.65
Cut Loss = 0.54

Got in last week at 0.57
Resistance to break is 0.61 and 0.65
Cut Loss = 0.54
Wednesday, August 15, 2012

Saturday, August 11, 2012


Wednesday, August 8, 2012

Tuesday, August 7, 2012


Monday, August 6, 2012

Sunday, August 5, 2012
HLCM
Daily:
- After a breakout from falling wedge, it formed a rectangle pattern. Signaling for a continuation of uptrend
- TP of Falling Wedge and Rectangle pattern is 13.8 to 14.
- Set stop loss depends on what price you bought
Weekly:
- Possibly forming a inverted head and shoulders pattern
Note: Not my recommendation for a buy. Just sharing my TA.


Friday, July 27, 2012

Wednesday, July 25, 2012

Monday, July 23, 2012
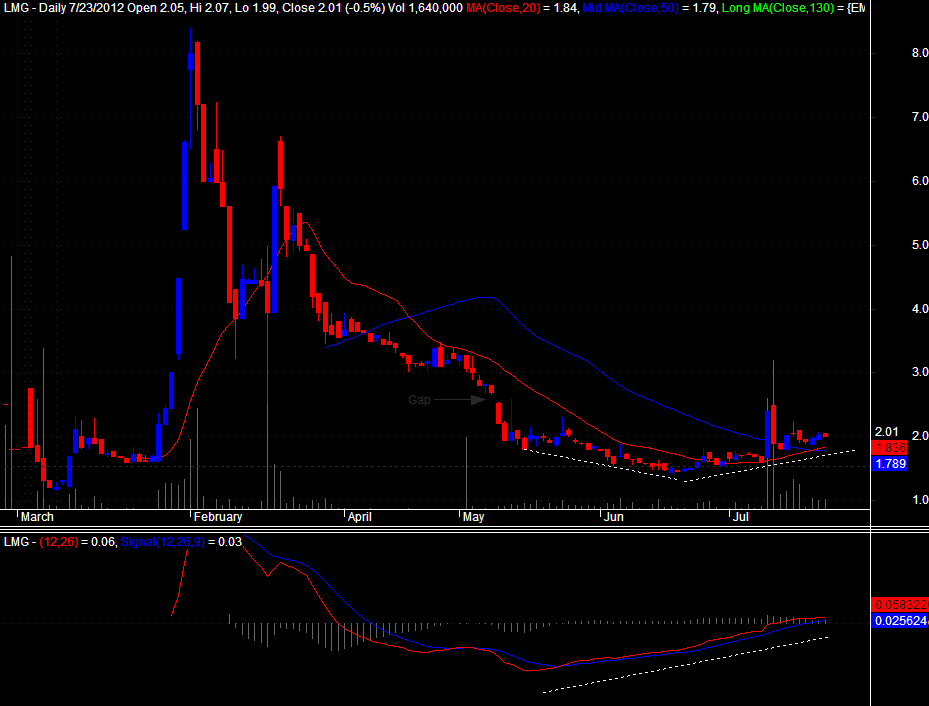
LMG
1. MACD Bullish Divergence
2. Price moved up and stayed above 20SMA (short term sideways to up)
3. Price just above 50SMA. Hope it holds there.
4. MACD and signal line just crossed zero line
Will it close the gap?
Stop loss if it breaks down 50SMA or ascending support line.
PD: meron pero onti lang ;P
Sunday, July 22, 2012


Friday, July 20, 2012


Sunday, July 15, 2012

Friday, July 13, 2012

Tuesday, July 3, 2012

Sunday, July 1, 2012
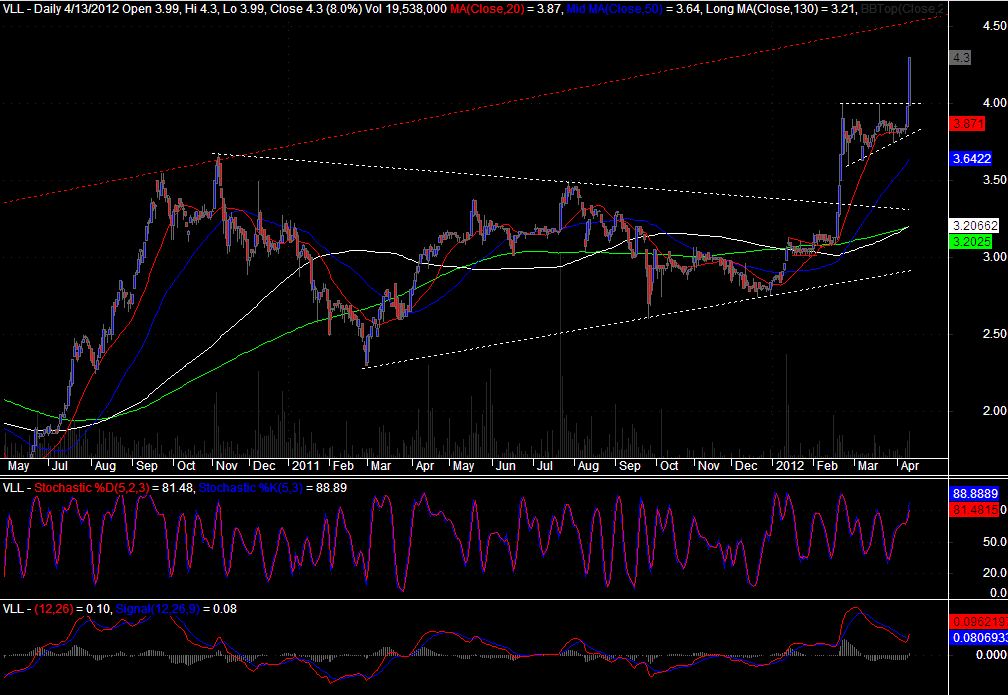
VLL
20 and 50SMA saying trend is sideways
BB = overbought area
STS = Cycle top waiting for confirmation

Sunday, May 6, 2012

Sunday, April 15, 2012
Saturday, April 7, 2012

Monday, April 2, 2012


Subscribe to:
Posts (Atom)