Saturday, December 31, 2011
DJI - Dow Jones Industrial Average
DOW down by 0.13% as of 11am ET.... Having hard time breaking the 12300 level... 3rd attempt will it break 12300 today? Divergence also spotted...

Thursday, December 29, 2011
Last trading day for 2011
All praises to my Lord and Savior Jesus Christ! Thank you for all the blessings this year.

Wednesday, December 28, 2011
FLI - Filinvest Land, Inc.
Showing some positive divergence... Let's see if it will reverse at 0.96 to 0.98 level. Price already at the TP of the Double Top. Also Price below the lower band... Meaning price already oversold and possible bounce there. Caveat.

Tuesday, December 27, 2011
LC/B - Lepanto Consolidated Mining Company
Chart Request: For discussion purposes... LC/B Forming a Cup and Handle Pattern - To be validated by our Experts in SMP if they are seeing the same...

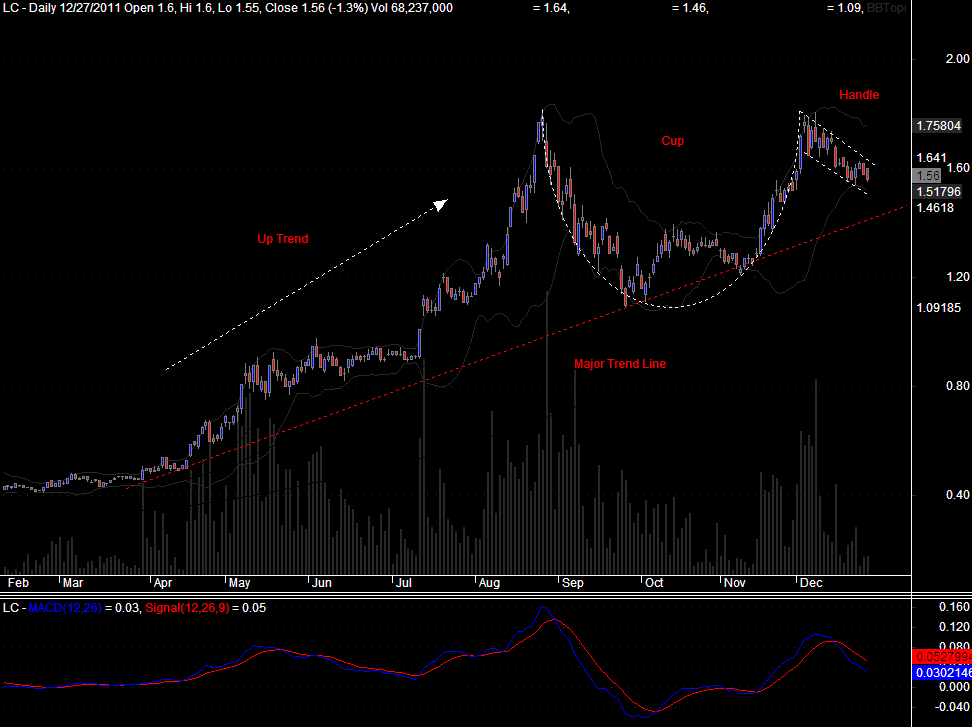
- 4 Month Old Cup... Volume also formed a U shape
- Almost a 3 week old Handle - A pennant/flag pattern... Volume decreasing...
For me, yung pattern na sinusundan ko is yung possible flag/pennant, if di matuloy yung pattern, then it might mature to a descending channel pattern moving down and test its major trend line... level is around 1.4x.
PSEi - PSE Composite Index
Price forming almost equal highs and higher lows... Possibly an ascending triangle? January of 2012 might be a good start if it will breakout from the horizontal resistance line. But for now, sa level nya... overbought pa siya as you can see sa indicator and price kissing the upper band. Support at 43xx.
If it will break down from the ascending support... This might form a rectangle pattern if mag bounce sa mga previous lows nya.
Advance Happy New Year! =)

If it will break down from the ascending support... This might form a rectangle pattern if mag bounce sa mga previous lows nya.
Advance Happy New Year! =)
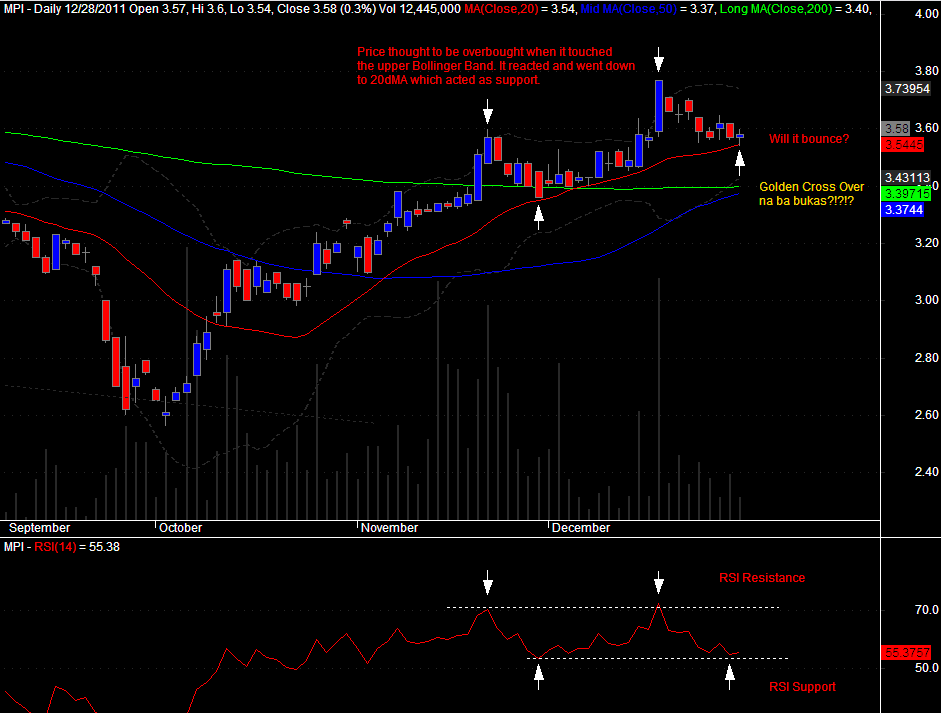
MPI - Metro Pacific Investments Corporation
Golden Cross Over of the 50dMA and 200dMA approaching...

FOOD - Alliance Select Foods Int'l Inc.
Price now testing support at 1.40... Also testing the 20dMA.
Hold if support at 1.39 to 1.40 holds...
Stop loss / Sell if price moves down below 1.39

CMT - Sotheast Asia Cement Holdings, Inc.
Quick update:

- Currently at the overbought area
- Immediate resistance at 1.66
My trading plan, I will hold if it breaks out from 1.66... Sell if mauntog siya sa 1.64 to 1.66 resistance.
Monday, December 26, 2011
Luke 6:35-36
35 But love your enemies, do good to them, and lend to them without expecting to get anything back. Then your reward will be great, and you will be children of the Most High, because he is kind to the ungrateful and wicked. 36 Be merciful, just as your Father is merciful.
LC - Lepanto Consolidated Mining Company
I was short term bearish last time with LC 'coz it went down below 20 day moving average... a bearish price cross over. Kala ko punta pa ito sa 1.40 level... Here's my previous post - LC
But it seems that LC is making a U-Turn....
Hmmm... if successful ang U-Turn nya... might retest 1.80 level? Let's see...

But it seems that LC is making a U-Turn....
- For the past 2 trading days, price is making higher close/low
- Bounce from the ascending support of RSI
- Possible bounce at the support of Stochastic... K line about to make a cross over to D line
- Possible Bullish Price Cross Over from the 20dma... I have to adjust my trend lines, good signal if it closes above the upper descending line
Hmmm... if successful ang U-Turn nya... might retest 1.80 level? Let's see...
Disclaimer: This is my personal technical analysis on this stock. It is not my intention to give a buy or sell advise. Trade at your own risk.
Wednesday, December 21, 2011
PX - Philex Mining Corporation
Update:
If you were able to buy at the reversal, my advise is to hold and test the resistance of the descending channel. Stop loss if it breaks down from the 2nd trend line.


- Formed a Bullish Harami Pattern Candlestick on the 2nd trend line last 12/15 and 12/16... Reversal was confirmed the next day.
- Daily chart shows a bullish divergence... Price makes lower low while Oscillator makes equal low. This type of divergence is classified as weak divergence.
- Formed a mini downward channel.. A break on that resistance would confirm the start of up trend
- On the Harmonic side, our fellow harmonic trader EPGarias from Stock Market Pilipinas (SMP) saw the harmonic pattern for PX... Here's the link - http://www.philstockanalysis.com/ and http://www.stockmarketpilipinas.com/Thread-EPGArias-Stock-Analysis?page=121
- Weekly Chart shows a bounce at the 2nd trend line and 50dMA
If you were able to buy at the reversal, my advise is to hold and test the resistance of the descending channel. Stop loss if it breaks down from the 2nd trend line.
DOW and GOLD as of December 21, 2011
Dow
12,103.58
+337.32
+2.87%
Previous post - testing the support line at 11,850 and 50dMA. Let's see if support holds....
Gold
1,623.10
+5.50
+0.34%
It seems that Gold is making a comeback to 17000 level... Let's see if LC will follow the trend.
12,103.58
+337.32
+2.87%
Previous post - testing the support line at 11,850 and 50dMA. Let's see if support holds....
Gold
1,623.10
+5.50
+0.34%
It seems that Gold is making a comeback to 17000 level... Let's see if LC will follow the trend.
LC - Lepanto Consolidated Mining Company
I just have to remind myself to be careful in entering LC... Below are the bearish signals I see;
Disclaimer: This is my personal technical analysis on this stock. It is not my intention to give a buy or sell advise. Trade at your own risk.

- Completion of the Bearish Bat Pattern - LC's Bearish Bat Pattern
- Bearish Divergence - Price almost equal high's while oscillators making lower highs.
- Bearish Price Cross Over - Price just closed below the 20dMA... Short term bearish... Long term bearish if it crosses below the 50dMA. See my previous post, a heads up on the possible bounce or bearish price cross over - Heads up
Anyway, I just checked http://www.bloomberg.com/ and saw that GOLD is now back to 1600 level... up by 1.27% as of this time. Possibly moving to 1700 level again? Let's see how LC will react on this today.
On the Bullish side, the Bull Flag pattern for me is still intact. Pattern failure na ito pag price today mag close lower pa than yesterday... I'll observe later price action, might do a test buy since Gold is possibly making a comeback baka sumunod si LC. Since I am still bearish with LC, If I see that the price action is getting weak today, immediately sell or stop loss to avoid ipit!
Disclaimer: This is my personal technical analysis on this stock. It is not my intention to give a buy or sell advise. Trade at your own risk.
Monday, December 19, 2011
Help Typhoon Sendong Victims
How to help
Pang said the PRC donation facilities, including for online transactions and bank deposits, are listed at http://www.redcross.org.ph/donatenow or click here also http://www.redcross.org.ph/donate
One of the easiest ways for people to donate is through the PRC SMS donation facility. Donors need only text RED<space>AMOUNT to 2899 (Globe) or 4143 (Smart), in amounts of 5, 25, 100, 300, 500 or 1000 for Globe, and 10, 25, 50, 100, 300, 500 or 1000 for Smart.
Deposits can also be made to the PRC’s
Banco De Oro peso account 00-453-0018647, dollar 10-453-0039482;
Bank of the Philippine Islands peso account 4991-0036-52, dollar account 004994-0103-15;
Metrobank account 151-3-041631228, dollar 151-2-15100218-2;
Philippine National Bank peso account 3752 8350 0034, dollar account 3752 8350 0042;
Unionbank of the Philippines peso account 1015 4000 0201; dollar account 1315 4000 0090.
Donations can also be made to Cebuana Lhuillier pawnshop branches nationwide.
Sunday, December 18, 2011
LC - Lepanto Consolidated Mining Company
Heads up!
Disclaimer: This is my personal technical analysis on this stock. It is not my intention to give a buy or sell advise. Trade at your own risk.

Disclaimer: This is my personal technical analysis on this stock. It is not my intention to give a buy or sell advise. Trade at your own risk.
MPI - Metro Pacific Investments Corp.
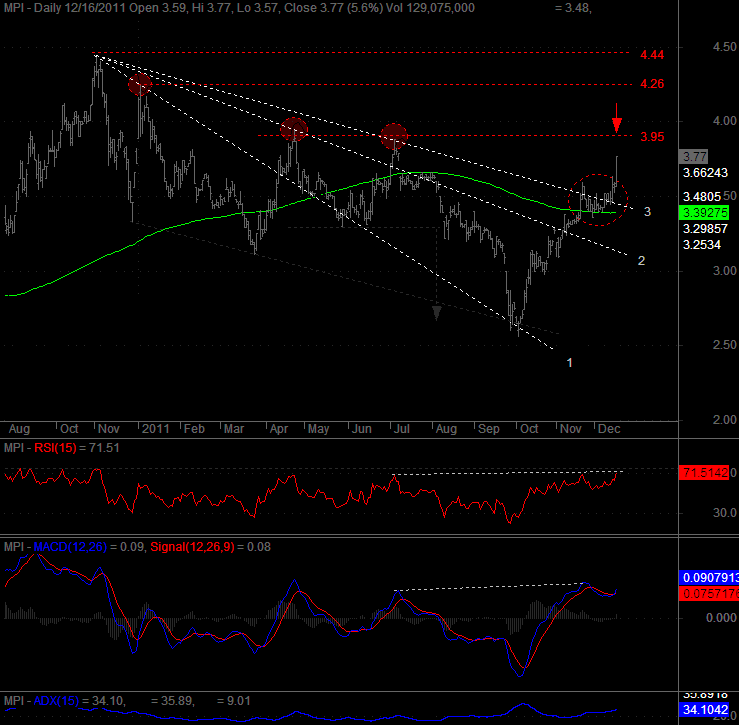
"Fan lines are drawn along successive peaks... The breaking of the third fan line usually signals start or confirmation of the up trend" - J. Murphy
Usually traders buy at the breakout of the 3rd trend line... you can check the net about the fan line principle. Baka kaya biglang taas nito last week with high volume daming nagbilihan at the breakout? what do you think? Anyway, let's have a review of MPI's chart...
MPI moved up breaking the 3rd trend line of the fan principle... This is a good signal for us na meron nito right? We also see positive momentum and strong trend... Check the resistances in red... For now, I hope it breaks out from the resistance of the double top converting that into a support. Honestly, I don't have a target price here yet. I just let if flow as long as I see the up trend intact and indicators saying that this is still okay I'll hold... Try ko mag long term dito since I got in before the breakout of the 3rd trend line.
Check out my previous post of MPI... Stochastic on the weekly chart already overbought... Let's see how it will behave considering it is on the overbought area - http://coffeechart.blogspot.com/2011/12/mpi-metro-pacific-investments-corp.html
Disclaimer: This is my personal technical analysis on this stock. It is not my intention to give a buy or sell advise. Trade at your own risk.
Saturday, December 17, 2011
BEL - Bell Corporation
A technical review of BEL's price action using trend lines, classic patterns, indicators, and harmonics...
Note: If price will move down from the 2nd trend line, I might sell some of my shares as this is my warning that up trend is weakening. Bearish once it breaks down from the 1st trend line.

Harmonic Pattern Forming - A Potential Extreme Bearish Harmonic Impulse Wave
BEL is now on the process of forming the B to C leg of the Extreme Bearish Harmonic Impulse Wave. However, price is now at the level of 1.13 of the xab... A pattern called Bearish 1.13 Extension—The Failed Wave. Let's see if this will be a roadblock going north confirming the pattern or just a pause before it moves up to form the larger pattern of the impulse wave.

- Possible formation of a Bull Flag. Flag pole formation from 12/7 to 12/8. Volume supports the potential pattern. We see a high volume at the flag pole and now forming the flag with a decreasing volume.
- Up trend and positive momentum is still intact. ADX reading above 25... trend getting stronger.
- A bounce at the 2nd trend line will signal me to buy additional shares
- Another signal for buyback is when it is about to break or upon breakout from the Bull flag
Note: If price will move down from the 2nd trend line, I might sell some of my shares as this is my warning that up trend is weakening. Bearish once it breaks down from the 1st trend line.
Harmonic Pattern Forming - A Potential Extreme Bearish Harmonic Impulse Wave
BEL is now on the process of forming the B to C leg of the Extreme Bearish Harmonic Impulse Wave. However, price is now at the level of 1.13 of the xab... A pattern called Bearish 1.13 Extension—The Failed Wave. Let's see if this will be a roadblock going north confirming the pattern or just a pause before it moves up to form the larger pattern of the impulse wave.
TEL - Philippine Long Distance Company
Let's take a look how TEL is doing for the past 4 years... Used weekly chart here.
Using the Fan Principle, we see that it just moved out or up from the 2nd trend line and poised to move up till it reaches and test the 3rd trend line. Using MACD indicator, it is showing a positive upward momentum... MACD line already moved above the zero line. This is a bullish crossover. A breakout from that resistance or 3rd trend line and resistance of the double top will definitely give us a good signal that this is a start of an up trend for TEL. As we can see, when it tested the 1st and 2nd trend line, this moved sideways to down also showing some bearish patterns (double top) inside the trend lines. Notice also the converging support and resistance lines forming a big triangle.
My say is that this will move sideways to up... Will test it's major resistances...
PD: No TEL
Thursday, December 15, 2011
DJI - Dow Jones Industrial Average
As of 11PM Manila Time, DOW up by +76.14 (0.64%). It is now testing the support line at 11,850 and 50dMA. Let's see if support holds till end of trading day. RSI rising and resistance is at 79. If DOW breaks down from the 11,850 support line, it will test the ascending support line. Good if DOW bounces from the 11,850 or yellow support line... A bad signal if it will breakdown from the yellow line coz there is a possibility of a double top pattern. For now, sideways to up is still intact.

Previous post - http://coffeechart.blogspot.com/2011/12/dow-jones-industrial-average.html
Previous post - http://coffeechart.blogspot.com/2011/12/dow-jones-industrial-average.html
Wednesday, December 14, 2011
MPI - Metro Pacific Investments Corp.
Weekly Chart shows that this is at the overbought area of stochastic... Also facing major resistances... descending upper trend line, 50 and 200dMA... I hope it does not close below 3.40... this week. Might give me an impression that it will move sideways to down muna kapag ganon. Hope it continues have higher lows making a slow breakout from the resistance line...
PD: Bye bye muna if mag lower lows pa ito this week or move down to 3.40

PD: Bye bye muna if mag lower lows pa ito this week or move down to 3.40
Tuesday, December 13, 2011
PGOLD - Puregold Price Club, Inc.
PGOLD forming an RSI Bearish Divergence. Price forming higher highs but RSI is forming lower highs. RSI does not confirm the new high and this shows weakening momentum... ADX line is still above 40 but falling showing strength is decreasing but this does not usually mean that the trend is reversing. I also read that it must be noted that divergences are misleading in a strong trend. A strong uptrend can show numerous bearish divergences before a top actually materializes.
In general, divergence is not a signal for a reversal, but rather a warning that trend momentum is changing.
Let's check the candlesticks... We see that there was a good run last week until a shooting star appeared yesterday... Now price formed a high wave candlestick... The last 2 candlesticks are signs of indecision. Might make a U turn or move sideways before it goes up again.
Disclaimer: This is my personal technical analysis on this stock. It is not my intention to give a buy or sell advise. Trade at your own risk.

In general, divergence is not a signal for a reversal, but rather a warning that trend momentum is changing.
Let's check the candlesticks... We see that there was a good run last week until a shooting star appeared yesterday... Now price formed a high wave candlestick... The last 2 candlesticks are signs of indecision. Might make a U turn or move sideways before it goes up again.
Monday, December 12, 2011
Property Sector Update
PROPERTY SECTOR
- Last Dec 7, I posted a chart that Property sector is forming a head and shoulders top pattern. Now forming the right shoulder... Price is now below the 20 and 200dMA. More bearish signal to come if it will move down from the neckline and 50dMA. MACD line now just below zero showing some bearish momentum there. Anyway, this still has a chance. I hasn't confirmed the pattern yet. Hopefully we get a good bounce from the neckline / 50dMA. For reference, click to check my previous post re - Property Sector Forming a Possible Head and Shoulders Top Pattern
ALI
- If you look at the updated chart, it already moved down the neckline, 50 and 200 dMA. RSI confirming the the breakdown as it is also making lower lows. MACD line just crossed zero... bearish signal. For reference, click to check my previous post re: ALI - Ayala Land, Inc. DMC
- Might retest the triangle's resistance line at around 38... Still no strong bullish signal for DMC after price moved out of the triangle. For reference, click to check my previous post re: DMC - DMCI Holdings Inc.MEG
- From a high of 1.81 it went down to 1.70 and closed at 1.72. Price now below the 50dMA. Let's see if it will bounce on the neckline negating the head and shoulders top pattern.
BEL
- This needs some rest... RSI and Stochastic saying that this is already overbought... K line about to cross the D line. MACD shows positive momentum and up trend is getting stronger. Fibonacci shows that support lines are at 4.62 (38.2%), 4.50 (50%), and 4.38 (61.8%).
Sunday, December 11, 2011
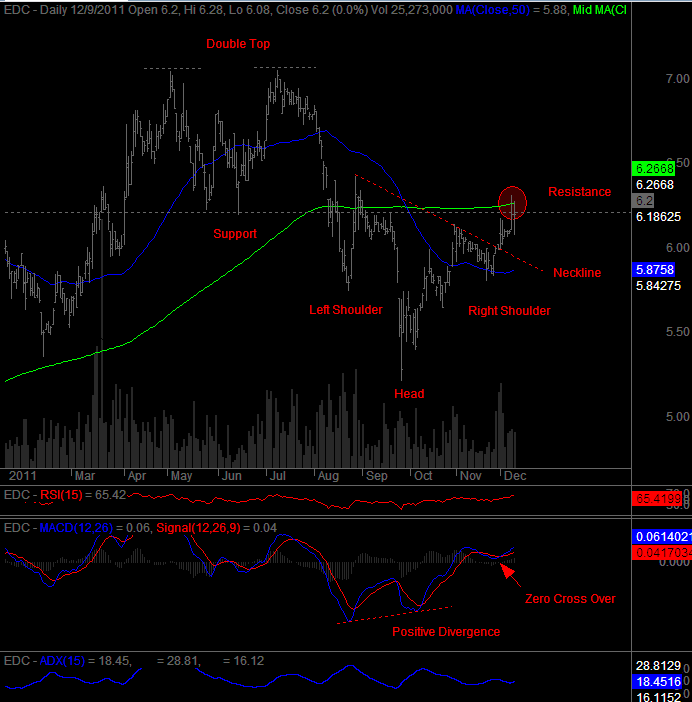
EDC - Energy Development Corporation
For me, EDC is now testing a critical resistance at 6.20 level. That's the support line of the double top which turned into resistance and at the same level of the 200 day moving average. If EDC breaks out from that resistance line moving up to 6.30 this week. There is a big possibility that it will hit the target price of the inverted head and shoulders pattern just above 7. That's the previous high of the Double top.
Moving Average Convergence Divergence (MACD) shows that there is a rising upward momentum but the uptrend is still not that strong based on the Average Directional Index (ADX) value just below 20. If ADX line moves up above 20 or 25 and rising, then the trend is getting stronger.
Last Friday (Dec 9), price action formed a Long Legged Doji. Long Legged Doji shows that there is a great amount of indecision in the market and is also a reversal type of candlestick. This definitely needs a confirmation on the next trading day in order to judge that a reversal may be starting. Having said this, it can do a return move on the neckline of the head and shoulders bottom pattern.
PD: I have EDC and my stop loss here is below 6 or at 5.90 level or if it breaks down from the neckline and or 50dMA.
Disclaimer: This is my personal technical analysis on this stock. It is not my intention to give a buy or sell advise. Trade at your own risk
DMC - DMCI Holdings Inc.
DMC making lower highs and higher lows last 10/25/2011 to 12/8/2011 forming a symmetrical triangle pattern. Last 12/9/2011, price closed above the descending resistance line. Breakout from the triangle? Let's see... Still needs confirmation. Immediate resistance is at 40. If it breaks out from that level, it will move to the triangle's target price which is above 42. Major resistance I see is at 43.
Just be careful nalang as for now, I am not seeing a positive momentum as MACD line is still flat and ADX line still below 20. Caveat!

Just be careful nalang as for now, I am not seeing a positive momentum as MACD line is still flat and ADX line still below 20. Caveat!
Saturday, December 10, 2011
DJI - Dow Jones Industrial Average
- 12,184.26
- +186.56
- +1.55%
As of December 9, 2011
If you check the weekly chart, MACD line is rising and just crossed the center line.

Friday, December 9, 2011
ALI - Ayala Land, Inc.
Will it bounce or move down sa 50dMA? 50dMA acting as support or neckline of the possible head and shoulders pattern. What do you think?
Anyway, candlestick/bars, rsi, stochastic, and macd still not showing any bullish or reversal signal.

Anyway, candlestick/bars, rsi, stochastic, and macd still not showing any bullish or reversal signal.
Thursday, December 8, 2011
Stock Updates
BEL - bullish candlestick and volume formed yesterday. this is now forming the c to d leg of the mini abcd pattern from 11/3/2011 to present. price is now at the 1.272 bc projection. next prz is at 1.618 of bc around 4.68. Still have this and planning to add. Long term ako dito. Riding the harmonic impulse wave. Classic TA nito is Inverted Head and Shoulders Bottom Pattern.
AP - retesting again the horizontal resistance line. for reference. see my previous post - http://coffeechart.blogspot.com/2011/12/aboitiz-power-corp-ap.html
ALI - ADX value nasa 14.48 and MACD falling down. RSI flat at 50... candlesticks showing indecision. sideways to down.
BHI - RSI below 40 and falling. ADX at 19.34. MACD below 0. Bearish pa ako dito.
DMC - RSI @ 46 and moving down. ADX at 10 and MACD below 0. Still not showing signs of life... sideways to down.
EDC - Slowly moving up. pero strength ng uptrend not strong. Sideways to up
FLI - candlestick pattern confirmed yesterday with a good volume. some indicators supporting the reversal. stock to watch.
JFC - looking good. bouncing from the 50dma. RSI above 50
MIC - possible reversal. might retest 4.54.
LC/B - both had a good volume and bullish candlestick. Bullish or Bearish confirmation will be today.
VITA - Vitarich Corporation
My VITA trading plan...
Last December 6, I was scanning some stocks to buy for December 7 trading and saw VITA. Below is my VITA chart last Dec 6. Indicators such as RSI, MACD and Stochastics are confirming the candlestick reversal. RSI was above 50 and possible bounce at 50dMA.

December 7, 2011 - bought some at 0.50 and 0.55. See updated chart below. MACD went above the signal line and value still above zero. Showing some positive momentum. ADX line above 20 and seems na tataas pa. RSI above 50 and moving up. Stochastic K line cross over D line... Now making higher lows since October. Take note na di pa mature yung trend kakastart palang. This might go up or biglang mag reverse pababa. Anything can happen so prepared my stop loss at around 0.47. Caveat!

Last December 6, I was scanning some stocks to buy for December 7 trading and saw VITA. Below is my VITA chart last Dec 6. Indicators such as RSI, MACD and Stochastics are confirming the candlestick reversal. RSI was above 50 and possible bounce at 50dMA.
December 7, 2011 - bought some at 0.50 and 0.55. See updated chart below. MACD went above the signal line and value still above zero. Showing some positive momentum. ADX line above 20 and seems na tataas pa. RSI above 50 and moving up. Stochastic K line cross over D line... Now making higher lows since October. Take note na di pa mature yung trend kakastart palang. This might go up or biglang mag reverse pababa. Anything can happen so prepared my stop loss at around 0.47. Caveat!
Wednesday, December 7, 2011
Thank you LC!
No more LC... from 1.54
50% binenta ko na at 1.77 last Monday
25% binenta ko na at 1.75 kahapon
25% binenta ko na at 1.70 kahapon
Nagbenta na ako to protect my profit since mataas ko na din nakuha si LC at 1.54 and added at 1.64. If I got this below 1.50 pwede ko pa hold. Abang nalang ulit ako.
Related to http://coffeechart.blogspot.com/2011/12/lcs-harmonic-bearish-bat-pattern.html
Property Sector Forming a Possible Head and Shoulders Top Pattern
PROPERTY Sector is forming a possible Head and Shoulders Top Pattern. Possible forming the Right Shoulder? My indicators RSI, Stochastic, and MACD is giving a signal that the market is on a bearish momentum. Let's see how it reacts to the neckline or the 50dMA.

Tuesday, December 6, 2011
Coffee and Puto ng Calasiao (Tama ang spelling?)
LC trading halt today but will be lifted 11:45am today. While waiting, kain muna ako puto ng calasiao and inom ng kape.
Stop loss ako kay Geri... Weak na yung momentum pataas.
Stop loss ako kay Geri... Weak na yung momentum pataas.
BEL and LR Updates
BEL confirmed its reversal today. It might move sideways to down muna. Immediate resistance is at 4.14. Might retest 3.99 / 4.0. I also used technical indicators RSI and MACD as another tool to check for bearish signals. When price was moving up to 4.43 last Friday, RSI and MACD did not confirm the possible breakout. It showed a signal that momentum is weakening. Short term bearish for now.
LR formed a Black Marubozu candlestick yesterday. The sellers controlled the price action from the first trade to the last trade. I posted my TA in Traders Pizza last November 30 and mentioned that the positive momentum is weakening and other indicators such as Stochastic D and K line cross over as well as MACD bearish cross over is giving a signal of a reversal. Immediate support levels are 8.97, 8.67, 8.36... Used Fibonacci retracement tool.
LR formed a Black Marubozu candlestick yesterday. The sellers controlled the price action from the first trade to the last trade. I posted my TA in Traders Pizza last November 30 and mentioned that the positive momentum is weakening and other indicators such as Stochastic D and K line cross over as well as MACD bearish cross over is giving a signal of a reversal. Immediate support levels are 8.97, 8.67, 8.36... Used Fibonacci retracement tool.
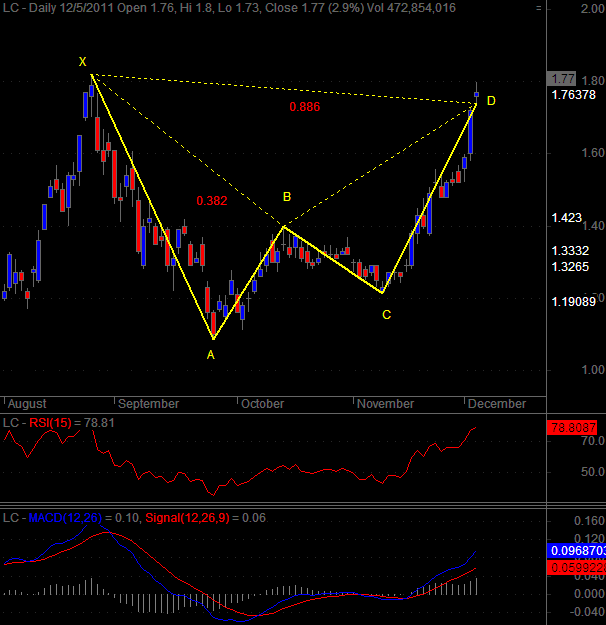
LC's Harmonic Bearish Bat Pattern
LC is now at the PRZ (potential reversal zone) of the Bearish Bat Pattern at 0.886 of XA. Will it react to the PRZ? The only bearish signal I see is that RSI is above 70... 78.80 to be exact and the Bearish Evening Star Candlestick... Let's see if today will be a red candlestick. That will confirm the reversal. Anyway, LC needs a break and have a healthy correction.
Technical Indicators are telling me that the uptrend and momentum is still strong. The good news is if LC breaks out totally or move up from the PRZ of the Bat, then it might go to the extended pattern which is the Bearish Crab. Measurement is 1.618 of XA. Lagpas Dos! =)
Btw, I sold half of my LC shares a while ago... might add up sa correction phase. my next profit taking is at the CRAB!
Monday, December 5, 2011
AP - Aboitiz Power Corp
Selling pressure weakening as seen on the price action. Forming higher lows and almost equal highs. Watch out for the possible breakout from the ascending triangle. MACD line about to cross the signal line.

Note: An ascending triangle is formed by (almost) equal highs and higher lows. It is a bullish signal, whether encountered in an up- or down-trend. It is most often observed as a continuation pattern in an up-trend but is a strong reversal signal when witnessed in a down-trend.
Disclaimer: This is my personal technical analysis on this stock. It is not my intention to give a buy or sell advise. Trade at your own risk.
Sunday, December 4, 2011
BEL - Bell Corporation
Price opened at 4.30 and went up to 4.43 marking it high for the day but as the end of trading approached, bears / sellers dominated as price went down to 4.28 marking the low and closed at 4.31. Price action for that day formed a shooting star which is a reversal type of candlestick. Needs a bearish candlestick on the next day to confirm its reversal. To negate the short term bearishness, price needs to break out from the resistance line above 4.42 / 4.43 with a high volume.

Harmonic Pattern Forming

Disclaimer: This is my personal technical analysis on this stock. It is not my intention to give a buy or sell advise. Trade at your own risk.
Welcome! =)
Coffeechart blog site is still under construction but I will start posting my technical analysis on selected stocks starting this week.
Subscribe to:
Posts (Atom)